TL;DR
- Bitcoin stabilizes near $68500 after liquidation-driven sell-off
- Derivatives markets saw significant long liquidations across major exchanges
- Key support holds between $66,000 and $68,000
- Resistance remains near $70,000–$72,000
- Market enters consolidation phase amid macro and geopolitical uncertainty
Summary
Bitcoin is stabilizing near $68,500 following a wave of liquidation-driven selling pressure in derivatives markets. Data from platforms such as Coinglass indicates a notable spike in long liquidations, signaling a reset in leveraged positions rather than a structural bearish shift. The current price action reflects consolidation, with traders closely monitoring key support and resistance levels for the next directional move.
- TL;DR
- Summary
- Bitcoin Stabilizes Near $68500 After Liquidation-Driven Sell-Off
- Derivatives Market Reset and Order Flow Dynamics
- Key Price Levels and Technical Structure
- Macro and Geopolitical Drivers
- Expert Market Insight
- Bullish vs Bearish Scenarios
- Strategic Context
- What Traders Are Watching
- External Reference
- Conclusion
- Disclaimer
Bitcoin Stabilizes Near $68500 After Liquidation-Driven Sell-Off
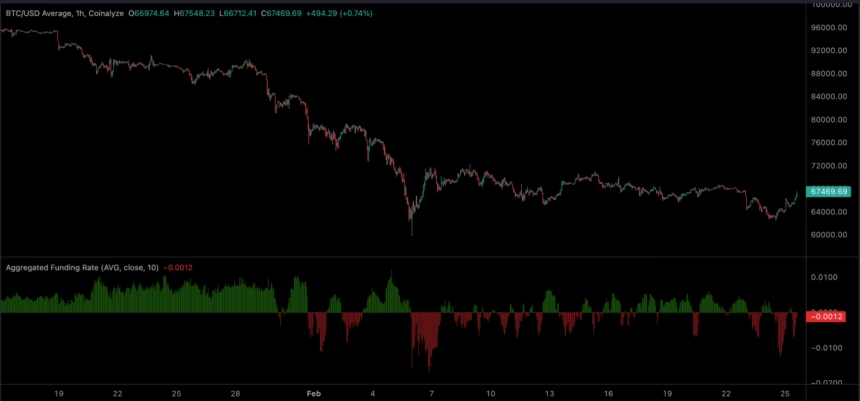
Bitcoin is currently trading near the $68,500 level, showing signs of stabilization after a sharp decline that briefly pushed the asset below the $70,000 mark. The correction was largely driven by cascading liquidations in the derivatives market, where leveraged long positions were forced to close as prices fell.
According to aggregated derivatives data from Coinglass, the recent downturn coincided with a surge in liquidations across major exchanges such as Binance and Bybit. While exact figures fluctuate in real time, the scale of liquidations indicates a broad deleveraging event rather than isolated selling.
This type of market behavior is typical following extended bullish momentum, where excessive leverage builds up and is eventually flushed out.
Derivatives Market Reset and Order Flow Dynamics
From a market microstructure perspective, the recent price action reflects a leverage reset phase.
When Bitcoin approached the $70,000–$72,000 range, funding rates across perpetual futures markets began to rise, indicating crowded long positioning. As prices reversed, these positions were liquidated, creating a cascade effect that accelerated downside movement.
Order book analysis on major exchanges suggests that:
- Buy-side liquidity began to reappear near the $66,000–$68,000 zone
- Sell pressure weakened after initial liquidation waves
- Spot demand is gradually stabilizing price action
This transition from aggressive selling to balanced order flow is a key indicator of consolidation.
Key Price Levels and Technical Structure
| Level Type | Price Range |
|---|---|
| Strong Support | $66,000 – $68,000 |
| Current Price Zone | ~$68,500 |
| Immediate Resistance | $70,000 – $72,000 |
| Breakdown Risk Zone | Below $65,000 |
The current structure indicates that Bitcoin is trading within a range-bound consolidation phase, rather than establishing a clear directional trend.
Macro and Geopolitical Drivers
Bitcoin’s recent movement cannot be viewed in isolation from broader financial conditions.
Macroeconomic Pressure
Global markets remain sensitive to interest rate expectations and inflation data. Risk assets, including cryptocurrencies, tend to react negatively to tighter monetary conditions.
Geopolitical Uncertainty
Ongoing geopolitical tensions have contributed to a risk-off environment, prompting short-term capital outflows from volatile assets.
Institutional Positioning
Institutional flows remain mixed, with some profit-taking observed after Bitcoin’s recent highs. However, there is no clear evidence of large-scale institutional exit at this stage.
Expert Market Insight
“The current move is less about trend reversal and more about leverage compression.”
From a trading perspective, this phase represents a healthy market reset. Excessive leverage is reduced, volatility normalizes, and stronger support levels are established.
Traders with experience in derivatives markets often view such periods as necessary before any sustainable upward continuation.
Bullish vs Bearish Scenarios
Bullish Case
- Bitcoin holds above $66,000 support
- Breakout above $70,000 confirms renewed momentum
- Increased spot demand and declining leverage
Bearish Case
- Breakdown below $66,000 triggers further liquidations
- Weak macro signals pressure risk assets
- Price retests lower support zones near $62,000–$64,000
Strategic Context
Bitcoin stabilization near $68500 reflects a broader structural pattern seen in previous market cycles:
- Rapid upward movement
- Leverage buildup
- Sharp correction (liquidation phase)
- Consolidation
- Next directional move
The market is currently in stage 4: consolidation, which often precedes either continuation or reversal depending on external catalysts.
What Traders Are Watching
- Funding rates across derivatives exchanges
- Spot vs derivatives volume ratio
- Institutional inflows/outflows
- Breakout or rejection at $70,000
These indicators will help determine whether Bitcoin transitions into a new bullish phase or faces additional downside pressure.
External Reference
For live market data and liquidation metrics:
Conclusion
Bitcoin stabilizing near $68,500 suggests that the market is successfully absorbing recent sell-off pressure driven by leveraged liquidations. The current consolidation phase indicates a temporary equilibrium between buyers and sellers, rather than a decisive trend shift.
The next major move will likely depend on whether Bitcoin can reclaim resistance levels above $70,000 or loses key support below $66,000.
Continue Your Intelligence Journey on Crypnot
- Deep Dive: Read our full report on the Coinbase Stock Perpetual.
- Announcements: Review the latest Press Releases.
Disclaimer
This article is for informational purposes only and does not constitute financial or investment advice. Cryptocurrency markets are highly volatile, and readers should conduct their own research before making any trading decisions.